Naver (035420.KS): Dominant Search Engine in South Korea

Company introduction                                       

Naver is an internet company well-known for its domination in the Korean search engine market with over 70% market share. When the company was founded in 1999, there was a severe lack of Korean language content on the internet. Naver pioneered a system whereby it crowd-sourced information from its users through blogs and Q&A forums. Its portal became the largest news aggregator, integrating all newspapers’ content with its own commenting system. Its online shopping platform is one of the largest e-commerce business in South Korea and half of the population in the country use its online payment system. The company is ramping up its investment in AI, payment and cloud computing. Outside of Korea, it is the majority owner (~73%) of the messaging app, Line. Line has a dominate position in Japan, Taiwan and Thailand with over 200 million monthly active users. It also makes money from gaming and advertising.

Competitive advantage

Naver’s competitive advantage mainly comes from its closed system and control of the Korean language content. A customer can browse the news, searching for information, buying products and interacting with friends. There is no need to leave Naver’s platform. Google failed to compete on search because it cannot access the proprietary data, which represents a large portion of the Korean language content. With the first mover advantage and smart content strategy in Korea, it has become a habit to use Naver in people’s daily life. Culture differences also contributed to Naver’s domination. When buying a product or service, people in Korea put more value on their friends’ recommendation. Naver’s platform provides an easy way to search for relevant information.

Integration with its own online shopping platform is also a major competitive advantage. Search engine is a tricky business. Majority of the people who search online do not generate any revenue for the company. Money is made when the ads are clicked, helping those who instantly want to purchase something find the best provider. The best search engine does not automatically become the best ads business. If Amazon becomes the only online retailer, there is no need to pay Google to search. Having a strong e-commerce business ensures that Naver will always be a choice for customers even the ads shift to e-commerce sites.

Long-term growth potential

The main drivers behind Naver’s long-term growth will always be the continued penetration of e-commerce, online payment and digital advertising. Despite the dominant position in South Korea, one could argue that Naver has underutilized its assets. In terms of user data, Naver has a complete picture of its customers, including online activity, search history, online purchase, payment, social interaction, mobile location and user-generated content. It is almost a combination of what Google, Facebook, Amazon and Paypal can get. However, Naver’s technological ability is relatively limited vs. global giants, partial because of its strong market position that makes it less incentivized to invest. With proper investment, it has the potential to bring better advertising/recommendation and capture more value in the market. However, the size of the Korean language speaking population will always be a limitation to the ultimate scale that Naver can achieve.

Why it is mispriced

There are two major reasons that caused Naver’s stock price to be undervalued. 1) Heavy investment: if we look at Naver’s ecosystem in South Korea, core business (ads for search and e-commerce) generates a huge amount of cash without the need of investment. The platform generates strong positive network effect. Marginal cost for additional ads on the platform is very low. New investment (categorized as expenses) was mainly in the payments, AI, new initiatives and most importantly hiring more engineers. If we believe that Naver’s asset is underutilized, the increased investment is the right long-term strategy for the company. 2) Short-term political issue: because of its domination in the news and social media, Naver was accused of opinion-rigging and fake news that indirectly influence the last presidential election. There are worries about potential regulation that can impact the company. But it is also a testament of the power it possesses.
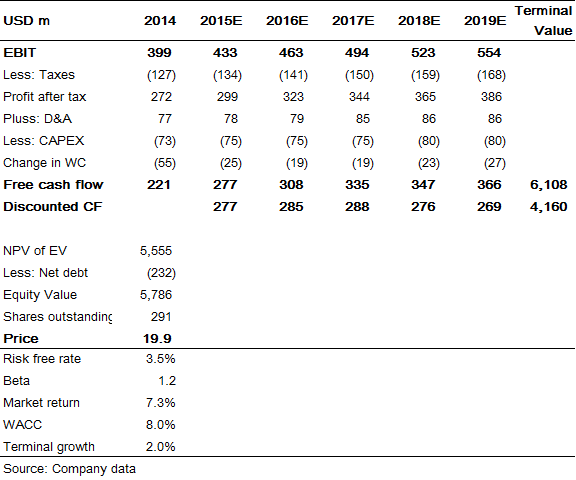
Valuation

In 2017, Naver’s core business in Korea generated revenue of KRW 3T (~$3bn) with operating margin of around 35%. And it was growing at ~15% annually. 25% of revenue was invested in R&D. If we apply a normalized 12% R&D to revenue ratio, which is the historical average for US tech companies to maintain market positions, Naver’s after tax earnings would be ~KRW 1T ($1bn). With a market cap of ~KRW 16T (excluding 4T net cash), Naver is trading at 16x normalized earnings. If we further subtract its 73% stake in Line, valued at ~KRW 6.5T, from the market cap. Implied core business in Korea is only trading at less than 10x.

Store Capital and Mispricing in Single Tenant Net Lease Market

Store Capital is a Real Estate Investment Trust (REIT) focusing on Single Tenant Net Lease market. The company was initially sponsored by Oaktree Capital (already exited after IPO) and recently got a lot of attention after Berkshire’s 10% investment. Single Tenant Net Lease market, despite being very liquid for a long time, is very inefficient in pricing individual stores. Store Capital claims that it is using a different way to explore those mispricing. The theory sounds promising but there needs to be more long-term data to validate that. A lower valuation close to its property acquisition cost ($20/share) will provide more margin of safety.

What is Single Tenant Net Lease

In the Single Tenant Net Lease market, investors buy free stand property and lease it to a single operator with the tenant covering taxes, insurance and maintenance. The type of property includes drug store, convenience store, dollar store, auto service, healthcare, quick service restaurant and any single operator property. Total size for the market is at least $2tn in US. Most of those lease contracts are long-term with initial period of 15+ years and several optional periods. The long-term lease contracts in a lot of cases are superior to the corporate debt in the restructuring. Depends on different types of tenant, investors usually get an annual rent increase of 1%-2%. National/regional brokers and exchanges exist for investors to trade in a liquid market. You would think that there should not be huge mispricing. But it is not the case.

Mispricing in the market

Cap rate is the mostly used valuation method to compare real estates. Investors use tenant credit, remaining term and other factors to determine a cap rate. For properties like residential, office and multi-tenant shopping malls, that make sense because those properties have a general purpose and their functions are the similar to a large group of potential tenants. However, that cannot be said about Single Tenant Net Lease. A movie theater and a car service center can only be used that way unless you invest a huge amount of money to rebuild it. Thus, the most important thing in valuing a Single Tenant property is to find out how long can that business continue without major investment (rebuild). However, the market is not valuing properties that way.

  • Same Tenant but Different Quality

If we think about two similar Dollar Generals with same rent and contract (initial term of 15 years and 5 optional 5-year terms). Mostly likely they are priced at the similar cap rate and price. Considering that most of the new Dollar General expansions are in small towns severing limited number of local people (Kind of in the middle of nowhere), Dollar General is very likely and easily to twist its store format and relocate to a new property in the same area. I doubt there will be a lot of value left in the old property. Assuming the extreme case that the value of property eventually goes to zero, IRR can be in a wide range of 1% to 8% depends on when Dollar General get out of the contract. Yet, the two properties are likely traded at the similar price.

Chart: Unleveraged IRR for soon the building’s value goes to zero  

1

Source: Estimation

  • Rated vs. Not rated

Another mispricing result from too much emphasis on tenant credit rating. Although there are some exceptions, a higher credit rating usually results in a lower cap rate (higher property price). However, the tenant only guarantees the rent payment in the period of ~15 years. Unlike a bond that also guarantees the principle payment, the terminal value of a property totally depends on the performance of that single store, not the corporate tenant that can leave. Yet again, market is valuing creditworthy properties closer to tenant’s debt. On the other hand, properties of smaller operators have a higher cap rate even their performance are the same or even better on a single store basis.

  • Different business in the Single Tenant space

The last mispricing is even harder to quantify. Investors can easily compare the IRR of different offices, apartments and even malls with indicators. But in the Single Tenant market, how do they compare AMC vs. Dollar General or Advanced Auto Parts vs. KFC. It seems to me the business of Single-Tenant property is more about business analysis than property analysis. True value depends on how well the operators run the businesses and how likely they are going to move. Below is a list of lease contract comparison for major operators.

Table: Comparison of lease contract

2

Source: Exchange Market

The Store Capital Way

After discussing all the mispricing in the market, here comes the Store Capital. The company is created by its experienced management team (supported by Oaktree) to explore those mispricing opportunities.

  • New Credit Rating System

Unlike other REITs in the segment, Store Capital clearly identified that value lies mostly in the single store level rather than corporate tenant rating. The management uses its experience and data to create its own way of ranking single store. Theoretically, the difference between Store’s ranking and market’s credit rating is the potential value creation over the long-term.

Chart: Store Capital Assessment of Credit vs. Market

3

Source: Company

  • Concerns about track record and capital allocation

Theoretically, I believe that the mispricing exists on a large scale in the Single Tenant Net Lease market and Store Capital has articulated a very interesting way to profit from it. Fundamentally, the business depends on the management being good investors figuring out which business and operator will last long enough to generate superior return. However, it is extremely hard to prove that the properties STOR bought are different. And there are several concerns around the company.

Track Record: It is true that the management has been in this industry for a long time and they are clearly articulating a different way of doing business. Store’s system led it to find more on operators like movie theater, education center and the type of properties that are unique and hard to be used other ways. While it gives those business a unique advantage in the local competition, it also increases the risk of re-tenant.

Chart: 2016 Store Capital rent breakdown by tenant industry

4

Source: Company

Capital Allocation: Having Berkshire as an investor is truly a vote of confidence in the company. However, selling shares to Berkshire at the valuation of less than 1.1x historical cost does not appear to be a prudent capital allocation if management believes they have bought undervalued assets.

Chart: Book Value Per Share and YoY growth

5

Source: Company

Valuation

The true value of the REIT is always the value of the properties in its portfolio. The balance sheet recorded historical cost and the accumulated depreciation. Real depreciation is tricky because it depends on how long the cash flow can come in before the investment goes to zero. Considering that the young age of Store’s portfolio, we can track its market cap vs. the historical cost of properties. A valuation of close to 1x will provide margin of safety.

Chart: Adjusted Price to Book Value over time

6

Source: Company

  • Real Estate value + rating system

There is another interesting way to look at the value of Store Capital. The company is a combination of two parts. One is the traditional real estate portfolio. The other is the unique rating systems they are trying to build. In case the system really works in the long-term as the management claims, there is a potential to even separate it into a pure rating company to serve the vast Single Tenant market. It is extremely difficult to execute with so many moving parts to determine whether a business is long-lasting. But who says a rating agency need to be right all the time.

SPD: One of the most hated company in UK may not be a bad investment

Download PDF report here: spd-stock-idea

Summary

Sports Direct (SPD) is the leading UK sports retailer with more than 50% market share. In the past year, almost everything went against the company and its stock price declined 63% in USD terms. Despite being probably one of the most hated companies in UK recently, SPD still has a solid balance sheet and a valid value proposition for customers. More importantly, most of the problems that caused the decline in valuation in the past year were either temporary or solvable. The depressed valuation of 1.2x P/B is not justified and presents an attractive investment opportunity as a contrarian play.

Investment Thesis

  • One of the most hated company in UK recently

Nowadays in the UK, it is hard to not notice the negative media coverage about SPD and its founder, Michael Ashley (owns 55%). To some people, SPD is almost identical to pure evil because of its labor practices. Investors hate it for other reasons as well. After decades of fast growth in the UK, its strategy of pushing its own brands started to backfire. Acquisitions in other European countries and Premium Life Style stores failed to meet expectations. Short-term impacts from weather, consumer trends, and GBP depreciation will add further pressure. EPS is expected to decline ~30% in the next year. Furthermore, the company’s plan to potentially increase investments in UK properties has clearly frightened investors.

  • Solid balance sheet and problems are solvable

In retail, a company’s income statement can be affected easily by a pricing/product strategy and other short-term factors over several years. But in the long term, the quality of the assets, the brand, and the value proposition to consumers still determine the intrinsic value. Opportunity can emerge as investors focus too much on income statements. In SPD’s case, the company has a strong balance sheet to weather the short-term fluctuations. The overall sport segment is probably the only healthy part in the retail sector now. SPD may overreached in promoting its own brand to increase margins. But this damage is not irreversible and management is doing the right things to repair relationships with third-party brands like Nike.

  • Corporate governance is an issue but capital allocation is efficient

Like other founder-owned companies, SPD’s corporate governance and capital allocation seem to be an outlier among public companies. Michael Ashley has made most of the decisions since he founded SPD in 1982. The company operated without a CFO for a while after going public. It bought a >10% stake in one of its listed UK competitors in 2008. It was actively trading similar retail/brand companies like DKS and ICON during market downturns. It recently announced a tender offer like buyback for 5% of its own stock. No matter how crazy those capital allocations may seem, the result speaks for itself. Well, at least it is better than a buyback at any price.

Valuation

The SPD stock price has dropped 64% in the past year and implies a valuation of ~12x depressed 2017 earnings and more importantly 1.2x P/B. PT of 4.63 is based on 2x P/B representing a gradual recover from trough 2017.

Company overview

Michael Ashley founded Sports Direct in 1982 and built it from a single store to dominance in the UK market in the following decades. Nowadays, the business consists of three segments: Sports Retail, Brands, and Premium Life Style. Although a lot of factors have contributed to SPD’s success in the UK market, its use of its own brand has clearly differentiated the company. We know that large retailers use private labels to lower their products’ prices and increase their margin. SPD; on the other hand, some acquire a large portfolio of well-known UK brands. The brand segment not only provided additional profit to the company, it also gave SPD the leverage when dealing with the 3rd parties like Nike and Adidas. In other European countries, SPD has built its business mainly through acquisitions, but it is still small relative to its competitors like Decathlon.

1

Core problem is the strategy and it is solvable

Despite having many problems like labor or Brexit in the headlines, there are two core issues that have driven down SPD’s growth and earnings: the backfiring of its strategy to promote its own brands and its failure to grow in other European countries.

Balance between 3rd parties and own brands

The combination of the largest retail assets in the UK and its own brand-filled portfolio gave management a lot of leverage. Its strategy is to always promote its own branded products, which generate higher margins. Even this practice hurts its relationships with third parties like Nike and Adidas. SPD’s dominant position in the number of stores guarantees that third parties cannot ignore it. However, there is a limit to how far SPD can push. For several years, margins have been increasing, but the third parties have started to respond by sending their latest products to SPD’s competitors.

2

In FY16, like-for-like sales growth at SPD declined to -0.7% from ~10% in the past five years, while its competitors were still enjoying healthy growth. FY17 is expected to be a tough year for SPD. However, management has recognized the problems and started to change. Previous targets of growing margins have been changed to repairing relationship with the third parties. Although it will take time for SPD to execute these changes and its earnings will be depressed in the short term, the strong asset base (stores and brands) makes the turnaround more likely.

Growth in other European markets

Before 2015, SPD was always regarded as the dominant sports retailer in UK with huge potential to grow in other European markets. Its stock was traded at a large premium because of this potential. However, the growth has disappointed, despite several acquisitions. In my opinion, one big advantage that SPD has in the UK is its brand portfolio. But those brands are mostly well known only in the UK. Moreover, there have already been several competitors with considerable market share. In my opinion, it is not reasonable to assume that SPD can copy its business model in continental Europe. But with the decline of its stock price and its expectations, the future returns will mainly depend on the UK market.

3

Negative sentiment exaggerated

Besides the two abovementioned fundamental issues, many other problems have contributed to the significant stock price decline in the past year. Those problems, with extensive media coverage, have enhanced the negative sentiment and created a perfect storm. They may have a huge impact on SPD’s short-term earnings and stock price, but they will not permanently damage the company’s long term earnings power.

Labor: Nowadays, it is hard to not notice the negative coverage of SPD’s labor practices. Some people think the company is pure evil and customers are organizing boycotts of its stores. There is no doubt that the company’s practices are not right. The customers’ reactions and one-time compensation/fines will depress short-term earnings. But purely from a financial perspective, the potential increase in long-term labor costs will not be unbearable. Investors can look at the case of Nike’s labor practice issue for comparison.

Macro: After the Brexit vote, the GBP depreciated sharply and SPD was caught off guard with no hedge in currency. The company is expected to take a hit in FY17, but this won’t be a recurring issue. In terms of Brexit, it is a huge risk and uncertainty to all the companies in the UK. After the vote, investors may assume that the British people will do whatever it takes to destroy their own economy, but at least that has already been priced in.

Corporate governance: For founder owned companies like SPD, corporate governance is always an issue. The company operated without CFO for a while after being public. It bought a >10% stake in one of its listed UK competitors in 2008. It was actively trading similar retail/brand companies like DKS and ICON during market downturns. It announced a tender-offer like buyback recently for 5% of its own stock. No matter how crazy those capital allocations may seem to be, the result speaks for itself. Well, at least it is better than those ‘buyback at any price’.

Valuation and comps

SPD is currently trading at ~12x FY17 earnings (vs. 5yr average of 16.7x) and 1.2x P/BV (vs. 5yr average of 4.3x). The company’s short-term earnings is depressed because of a combination of several problems mentioned above. However, the long-term earnings power is much higher vs. current level. PT of GBP4.63 (2x P/BV) in 12-18 month as company fix its UK strategy problem and negative sentiment gradually ease.

4

PWE: Update on Asset Sales

Download PDF report here: PWE – Comment on Asset Sales

I first wrote about this company last year. At that time, it was a kind of deep value play. The company had huge amount of debt and much more assets than they can develop. Despite having enough good assets to cover the debt, market treated it as a candidate for bankruptcy. On 10 Jun, PWE announced selling of its Dodsland Viking asset for CAD$975m (vs. ~CAD$500m reported by Reuters a week ago). Including the disposal of other non-core assets in 2016, PWE brought down its debt from CAD$2.1bn to CAD$600m. After suffering two years from low oil price and high debt, PWE finally finished its transition to a low cost producer with strong balance sheet and huge growth potential. Despite an impressive 37% increase in stock price after the deal, the company is still severely undervalued and posed to outperform in both the short-term and long-term.

Background information

PWE was one of the largest conventional oil and gas producer in Canada. Before 2013, the previous management did a poor job by focusing too much on land accumulation. This left the company with massive land beyond its capacity to develop and over CAD$4bn debt. Since 2013, the new management team (from Suncor and Marathon) has been focused on improving the cost structure and selling non-core assets to bring down the debt. However, the declining oil price has put enormous pressure on the company since 2014. It had to renegotiate its debt covenant in 2015. Although most people agree that PWE has some good assets, the word ‘bankruptcy’ was in most of the company’s news recently.

Asset sales has eliminated most of the debt

The deal was a complete surprise to the market and a game changer to PWE. To make it simple, PWE has three core assets of good quality. Two (Cardium and Dodsland Viking) have already been in production and one (Alberta Viking) is in the initial stage. The selling of the relatively smaller Dodsland asset has significantly reduced PWE’s outstanding debt. Moreover, management indicated that they will continue to dispose non-core assets in H216 and further strengthen its balance sheet. Although the market doesn’t like shrinking production, management is right to shift capital to more efficient assets even that means short-term production decline.

Good management + low cost asset + strong balance sheet + huge growth potential

By the end of 2016, PWE will become a completely different company. Its production will concentrate in Cardium, one of the best light oil assets in Canada. Management has indicated an operating cost per boe of CAD$10-12 (among the best in Canada). Under the oil price of US$45-50, management expect the production to grow 10% annually from 2017. And thanks to the massive accumulated lands, there will be enough space for PWE to grow at least in the next decade. In the meantime, the company is also likely to copy its success in Dodsland to Alberta Viking.

Valuation

Despite a 37% surge on 13 June, the stock price of US$1.26 is still trading at a severe discount to its intrinsic value. The price target of US$3.1 is based on oil price of US$45-50. Cardium asset alone is worth at least US$2 per share after subtracting all the debt. The company’s valuation still looks more like a distressed player while default is not a concern anymore. Eventually, company should trade above its book value of over US$4.

1


WDC: Time to be optimistic

Download: WDC – Time to be Optimistic (PDF report)

Summary: Western Digital—the leading Hard Disk Drive (HDD) maker—has been feeling the pressure in the past 12 months due to an accelerated decline in PC sales and increased adoption of Solid State Drive (SSD). Last year, the company acquired SanDisk, an SSD maker, to diversify its business. The market thought that Western Digital paid an unjustifiably high price for SanDisk at a time when the competition in the SSD market was heating up due to 3D NAND technology. The company’s stock price declined from $100 to $37. However, this acquisition has the potential to fundamentally change the risk profile of WDC in the impending technology shift. Despite short-term headwinds, the storage market will grow in the long term and Western Digital is best positioned to benefit.

Investment Thesis

  • Before acquisition, a dominant player in a declining HDD market

The HDD market came a long way via consolidation to reach the state of trioploy in 2012. Western Digital (43%), Seagate (42%), and Toshiba (15%) have since maintained a balanced market and earned decent returns. During this period, Western Digital achieved a 28%/22% Gross/EBITDA margin and maintained an average ROIC of 14%. However, nothing is static in technology, especially for commoditized hardware. The emergence of SSD has slowly intruded into the HDD market. The development of 3D NAND may further lower the cost of SSD and break the balance in the HDD trioploy.

  • An underestimated acquisition that changed the competitive landscape

Although the acquisition of SanDisk may appear to be expensive, it completely changed Western Digital’s risk profile. Of the three storage technologies, the new Western Digital’s products are the leaders in HDD and planar SSD. The company is also fighting in the new 3D NAND development. Before the acquisition, there was a risk that the success of 3D NAND would permanently shrink Western Digital’s addressable market. Now, however, Western Digital’s technology portfolio ensures that it can prosper under all scenarios. Moreover, Toshiba’s small share in the HDD market and joint venture with SanDisk will provide it with an incentive to improve its cooperation with Western Digital and this will put pressure on pure players like Seagate.

  • Short-term headwinds masked long-term growth potential

Instead of completely replacing HDD, SSD provides a cost-effective way for certain applications. The future of storage will be a mix of both devices. But it is also incorrect for the bulls to assume that all data will just move to the cloud without any impact on storage demand. Indeed, most of the pain in the HDD market was caused by shifting to the cloud. In the short to medium term during this transition, both the HDD and SSD will be under pressure. But after the transition, storage demand will again match the exponential data growth, and Western Digital is best positioned to capture that growth

Company overview

Western Digital is a hardware maker in the storage segment, mainly HDD, which can be categorized as a commodity despite some differences in the quality and technology. It was very hard for companies to achieve excess returns in the early stages. However, the industry experienced several rounds of consolidation between 2000 and 2012. Currently, three companies controlled 100% of the market, with Western Digital leading at 40%. The company has improved its EBITDA margin from below 5% to constantly over 20%.

1

With data growing and the PC market booming, global HDD shipments recorded a 17% CAGR from 1990 to 2010. Since then, overall unit demand has declined due to decreasing PC sales and the emerging SSD. Although three companies still maintain a balanced market and decent returns, accelerated declines in recent quarters and the development of 3D NAND technology have signaled trouble ahead. This is why Western Digital entered into an agreement to purchase SanDisk in 2015.

2

Underestimated acquisition

What Western Digital paid for its acquisition is clear. The elevated multiple is the most controversial part in the market and the new debt is an additional cost. However, if investors will consider the intangibles that WDC got from the deal, then the overall picture looks different.

Competitive advantage from a diversified technology portfolio

On a standalone basis, the SanDisk acquisition may seem to be unreasonably expensive, but from the industry’s point of view, the combined company will gain a much stronger position. To simplify, the storage business can be classified into three technologies. The HDD has matured and held most of the digital data in the past. It has the lowest cost, but its performance is also relatively slow. The traditional SSD is much faster than HDD, but it is also at least 5x more expensive. The latest technology, the 3D NAND, has the potential to massively lower the cost of SSD and make it competitive with HDD in more applications. However, the characteristics of HDD and SSD ensure that both will be used in the future storage business. The technological issue is now more about mixing and matching the right hardware to a specific application. Below is a summary of the technology portfolios of the major players in the industry.

Technologies portfolio of major industry players:

3

Before the SanDisk acquisition, investors in WDC worried about the new 3D NAND technology that could replace HDD on a large scale. Actually, it could be a question of survival for WDC. The success of 3D NAND may permanently shrink its addressable market and break the balance of the HDD triopoly. With the acquisition, WDC now has the ability to weather all kinds of scenarios. If 3D NAND turns out to be a huge success, WDC is in a much better position versus Seagate and is more likely to dominate the remaining HDD market. If 3D NAND fails, WDC’s leading position in the HDD and traditional SSD will still help it to succeed in the storage market. Ironically, the WDC stock price was trading at a much higher level when there were huge long-term risks to the company before the acquisition.

Relationship with Toshiba

Another overlooked factor is Toshiba. Its existing SSD joint venture with SanDisk can help to improve cooperation between Toshiba and Western Digital, even in the HDD market. This would put Seagate in a very difficult position. Although Toshiba only has ~20% of the HDD market compared with ~40% each for WDC and Seagate, this dynamic becomes important in a potentially shrinking HDD market. Eventually, there may need to be further consolidation in the industry, and the loser is increasingly likely to be Seagate. Again, ironically, STX was performing much better versus WDC after the acquisition.

Storage demand will grow, but it will take a while

The shift to the cloud has claimed a lot of casualties in both the software and hardware industries. Its impact on the storage segment is a bit complicated. The growth of the underlining data has never been stronger, but the storage manufacturers seem to be suffering. To have a better understanding, we can divide growth into two stages, and the first is the transition to the cloud. During this stage, demand for storage will actually go down. Unlike in the PC era where HDD had a relatively low utilization rate (mine was below 50%), that rate will now increase and less total storage will be needed in the cloud platform. Moreover, instead of having 100 of the same files on 100 PCs, now you need only one in the cloud. At this stage, the main theme is to improve the efficiency of storage systems. However, there is a limit to this efficiency. This brings us to the second stage where storage demand will eventually catch up with the data growth.

4

The acquisition has put Western Digital in a very comfortable position to benefit from the long-term data growth. We can divide the storage market in a different way: 1) DRAM, the memory that works alongside CPU to facilitate fast calculations, 2) end users, traditionally PC and now also those mobile devices, and 3) storage, the major devices that store most of the data for the long-term. Below is a summary of the segments and the players.

Different industry classification:

5

Source: Company data

DRAM and end-user segments are actually not highly correlated with the long term data growth. DRAM is more about improving the performance with the CPU. With the trend of cloud architecture, less data is stored on the user end. The task of storing future data will fall to the middle part with the usage of both HDD and SSD. Western Digital, after the acquisition, is best positioned to capture the long-term growth in this segment.

Valuation

Western Digital announced the closure of SanDisk acquisition on May 12. On the pro forma basis, with conservatively estimated synergies from both SNDK and MOFCOM, Western Digital can achieve adjusted earnings of around $1.9bn in CY2018. 18-month price target of $68 with implied P/E of 10x. Current market price is suggesting that there won’t be any synergies.

6

Despite recent headwinds, the storage market is still a solid industry in the long term with limited players. The acquisition of SanDisk gave Western Digital more competitive advantage over its peers with an attractive technology portfolio. Although the growth will take some time to materialize, the depressed valuation is not justified and provides opportunity investors.

HLPPY: A Unique Property Developer for Long-Term Investors

Summary: Hang Lung is a developer in Hong Kong, China, focusing on property development, leasing and sales. The company uses a unique business model with almost no debt. It grows free cash flow (FCF) through the long-term holding of the best commercial properties in several promising cities. It is occasionally involved in residential property development on a counter-cyclical basis. The company is in the process of repeating its business model in seven of China’s second-tier cities and is expected to significantly increase its FCF over the next decade. A valuation of 0.51x P/BV is not expensive, but the incoming problems in China will provide better opportunities for long-term investors.1

Unique business model as a property developer

The current management took control in 1991. At that time, Hang Lung was not that unique and its portfolio mainly consisted of shopping malls, office buildings and residential apartments in Hong Kong. Since then, the management has used the cash flow from those properties to pursue two unique strategies. For most of the property developers around the world, their businesses usually include buying land, developing the property and selling the final products. Those low-margin businesses depend on debt financing and a high turnover rate to achieve a reasonable return. Eventually, companies encountered trouble when property prices declined. That was the case for U.S. developers in 2008, and that was truer for emerging market developers who faced much higher volatility. However, Hang Lung has a completely different business model. It made profits from its long-term purchasing power increase and price volatility. Its two main business models can be summarized in the following chart.

2

Source: Company data

Hang Lung has two business segments: property leasing and property selling. In 2015, its property leasing revenue reached HK$7.7bn (87% of total). Within the property leasing segment, HK$3.6bn came from Hong Kong, HK$2.9bn came from two properties in Shanghai and HK$1.3bn came from 6 other properties in China. Property sales segment were much more volatile because of the company’s strategy to be contrarian and opportunistic. Annual property sales range from zero to HK$10bn in the past decade. By the end of 2015, Hang Lung had 692 units available for sale booked at the cost of HK$4bn.

3

Source: Company data

Success in Shanghai can be repeated

The best way to understand Hang Lung’s property leasing strategy is to look at its two projects in Shanghai. The philosophy of the management team is easy to understand. The company’s success depends on picking a promising city at the early stage of growth, buying land at the best locations at low prices; building the best property and having the best team handle the leasing. In Shanghai, the company bought the land in 1992 and the operations started around 2000. Since then, rental revenue has surged with the purchasing power of consumers. Annual rental revenue now represents ~50% of the total accumulated investment cost (HK$6.3bn), translating to a ~30% net return on investment. Once the property is completed, maintenance capex is very limited compared to cash flow. Although the property cycle can be volatile, the best location and quality with no debt ensures that there are very limited competitors in the long term.

4

From 1992 to 2005, those two properties were the only assets in China for Hang Lung because the management insisted on only doing the projects that met all their criteria and maintaining minimum debt. During 2005 and 2007 when the property market in China was experiencing a downturn due to government policy, Hang Lung found the mix it wanted and expanded its land portfolio into 7 new cities.

5

Since 2010, new projects in those cities have gradually started operations. Although the new/potential projects have a much larger combined gross area floor vs. 2 projects in Shanghai, rental revenue is only half of Shanghai’s. However, from the return on investment point of view, its average 8% is higher than 5% when Shanghai properties opened. It has the potential to capture the purchasing power growth in second-tier cities in China over the next decade.

6

Contrarian in residential development

Unlike normal property developers who make money from a high turnover rate, Hang Lung occasionally entered into the residential development market in Hong Kong. The company holds a contrarian view on this segment of the business. Because the company usually maintains a net cash position, it bought land during the financial crisis when no one had enough cash and sold properties gradually along the cycle and partially financed its investment in property leasing. During 1999 and 2001, the company bought a huge amount of land at very low prices. Since 2001, property sales have contributed ~HK$40bn to revenue with a margin over 70%. The company still has 692 units in inventory available for sale valued at over HK$8bn at the end of 2015.

7

Why no one can copy it

We already know that the keys to success in Hang Lung’s business model are: Location + Quality + Team + Identifying promising cities + Low land price = Success. Every emerging market property developer knows that location and quality are important. They also know that price is volatile and debt can be a problem. But there are some unique factors for Hang Lung’s management and strategy to create a deep moat around its business.

  • Disciplined management team: While it is easy to figure out the keys to success, it is a completely different story to stick to it. Hang Lung has shown an amazing track record by strictly following those criteria. In the years before the 1997 Asia financial crisis, management was selling properties to raise cash and refusing to buy any land when analysts accused it of being over conservative. During 1999 and 2001, the company was aggressively buying land when analysts accused it of being too optimistic. It was the same when Hang Lung bought more land in China from 2005 to 2007. Each time, management ignored the market’s demand and made the right decision.
  • Best location + property: The biggest difference between Hang Lung and other developers is the intention to be the long-term holder of the best properties. While a leveraged developer of a mediocre shopping mall is subject to fierce competition, a well-built shopping mall in the best location of an emerging city operated by a great company with no debt can be an exposure to the purchasing power increase in the long term.
  • Brand: It may initially sound counter-intuitive that it can be a good thing to open a shopping mall during a downturn or a crisis. But it is definitely the case for high-end stores (especially for emerging market cities). Hang Lung’s properties in Shanghai provide the best example. When there were no competitors, Hang Lung set up its brand as a representation of the highest-end shopping mall. In the following years, it reaped the benefits of rising purchasing power. Moreover, the ‘Hang Lung’ brand has become a very effective tool for the company to expand to second-tier cities.
  • Relationship with global brands: It is not exaggeration to say that the global luxury brands came into China hand in hand with Hang Lung. In the early days, you could find the flagship stores of most luxury brands in Shanghai’s Plaza 66. Through years of cooperation, Hang Lung has cultivated great relationships with global brands. You can now find similar brands in Hang Lung’s new projects in second-tier cities. Hang Lung has clearly positioned itself as the host of global high-end brands and there is massive growth potential in the long term.

Short-term headwinds from economy and property cycle

Despite its long-term potential to profit from a purchasing power increase, Hang Lung will face some headwinds in the coming years. The problem of the Chinese economy is an obvious one. The cyclic downturn in the Hong Kong property market will also add pressure to both property sales and rental revenue. Corruption in the local governments can make trouble for the company. However, with a clear focus on creating long-term value and a very strong balance sheet, Hang Lung can turn troubles into opportunities.

  • China Economy: As I have mentioned in my past articles China Rate Cut: Unintended Consequence – May 1, 2015 and China Update: Equity market crash is just a tip of the iceberg – Aug 24, 2015, there are significant risks in the next several years in China. Overcapacity in the property sector and over-investment in infrastructure are the core problems. The company may face pressure from currencies, rentals price and property valuations. However, investors should clearly separate highly leveraged properties that face significant competition with similar properties from those that have real competitive advantage and can differentiate themselves in the market. Either through a soft landing or a hard landing, China will eventually shift to a more consumer-focused economy. This will be positive for an unleveraged Hang Lung in the long term.
  • Property Cycle: Property prices have been moving in big cycles, especially in the emerging markets and are highly correlated with the monetary policy. The rising dollar has started to put pressure on the property sector and the investors may see lower rental revenue as a result. But the volatility of the rental revenue is much lower compared to that of the property prices, especially for the best properties in a city.
  • Corruption: Among Hang Lung’s 7 projects in China outside Shanghai, 1 project in Tianjin met a problem related to corruption. While Hang Lung bought the best land and built the best property in the city, the local government used a lot of safety regulations to delay the project. At the same time, a company that has a deep relationship with the local government was able to start operation 18 month earlier than Hang Lung and grabbed some top luxury brands. Hang Lung had to change its strategy to start with slightly lower-end brands. Although the return on this project is similar to other 6 projects, it clearly could do better.

Valuation

According to accounting rules in Hong Kong, companies need to revalue their property-for-lease annually and mark to market. Hang Lung is currently trading at 51% of its 2015 year-end book value vs. 62% of peers. It is interesting that the discount to book value have completely wiped out all the revaluation gains since 2005. It means the investors are literally buying most of the assets at 2005 cost. Considering management’s conservative nature and the amazing property price surge in the past ten years, Hang Lung’s valuation is not expensive even there is a property market crash. Hang Lung is also uniquely positioned within the property sector. Comparing to listed developers in Hong Kong which also has relative low debt, Hang Lung has a higher exposure to China (47%) and more revenue from stable leasing (87%). At the same time, most of the mainland developers are heavily in debt.

8

It is very hard to predict when and how the property bubble in China will burst in the short-term. But for a company with almost no debt and predictable management team like Hang Lung, it is easier to look into the long-term. Below is a scenario analysis on the rental part of the business. This excludes the 692 units of mostly sea-view apartment inventory in Hong Kong (~HK$8bn) and potential more investments by management during the future crisis.

9

Although Hang Lung’s Hong Kong portfolio may only be categorized as of normal quality, its China portfolio consists of best properties at best locations in cities with over 10 million people. The assumed annual rental rate is still much lower vs. comparable properties around the world. Market’s worry about a hard landing in China is justified. But adjustment to a consumer focused economy even through hard landing will be positive to Hang Lung in the long-term. Managements’ track record suggests that they will definitely use the strong cash flow and balance sheet to take advantage of the crisis. This is the case when long-term investors should be happy to see a crash.

HMHC: Good business in the wrong hand

This is a revisit to a short pitch in a group stock pitch competition last year. Although I do not think this company is a convincing short at current level, it is still an interesting case to look at. Buffett once said: ‘When a management with a reputation for brilliance tackles a business with a reputation for bad economics, it is the reputation of the business that remains intact.’ It is the case most of the time, but good business is not a guarantee to success. Sometimes a poor management team can gradually destroy company’s competitive advantage and shareholder’s value. Houghton Mifflin Harcout (HMHC) has the potential to become one. It is a dominant player in the growing K-12 education content market. However, during the transition to digital, management has been mainly focused on maximizing short-term result and failed to invest for the future, especially in the technology platform. With a confusing accounting practice, market is valuing the company based on a peak earnings in a volatile industry. The unrealistic expectation has setup the company for disappointment in both the short-term and the long-term.

Solid business but poor return

HMHC’s main business is selling educational content to K-12 schools. The selling process is very complicated and it normally takes over two years to close a deal. The company needs to get approval from State Committees, Legislature and Districts for the solution to win a state contract. However, this also provides significant barriers to entry for this industry. Three companies collectively control around 90% of the market share and HMHC is the leading player with an attractive margin. Although the business is very volatile on a YoY basis due to its dependence on state budget, long-term demand is very stable and highly correlated to the enrollment.

1

Despite having an attractive business to operate, HMHC did not generate exciting returns in the past and even went into bankruptcy. The company was a target of a leveraged buyout in 2006 and it did several bolt-on acquisitions in 2007. From 2008, the financial crisis started to put a huge pressure on state budget. The lower demand, high interest burden and poor execution led company into troubles. The debt was restructured several times from 2009 to 2011. The company finally went into bankruptcy in 2012 with most of the debt holders changing to shareholders.

2

The company replaced the whole management team in 2011. The new CEO was from Microsoft and had a great resume. The company went public again in 2013. From investors’ point of view, the stock can be really attractive with good management and a solid business. However, in the past two years, there were signs that management still focused too much on short-term performance and under-invested for the future. Short-term FCF has been maximized and new debt has been issued to support buyback. Management’s compensations through option are highly aligned with the old debt holders who will likely exit in the near future.

Confusing accounting, valuing company based on peak earnings

Contrary to its competitors like Pearson, HMHC seems to be very complicated for investors to analyze. There are two differences in accounting that contributed to the complexity. First, the company decided to use accelerated amortization on its revalued publishing rights during the chapter 11. Although there are tax benefits for the accounting treatment in the early years for HMHC, it is not sustainable and FCF is overstated in early years. Second, HMHC is in a transition from selling print content to selling digital content. Although the underlining business models are completely the same, the accounting treatment on revenue is different. This resulted in a much faster growth in billings, deferred revenue and FCF.

3

4

The confusion led some analysts to believe that HMHC is transforming into a different business model and the cash flow can be more sustainable. Comparing HMHC to some truly successful transition like ADBE, the same increase in billings and deferred revenue are telling completely different stories. While an increase in short-term deferred revenue is a good indication that the customers will continue to pay subscription cash next year without more efforts, an increase in long-term deferred revenue in HMHC’s case is basically saying that the company won’t get any cash from that specific customers for at least 5 years. Despite all the confusion in the accounting changes, HMHC’s underlining business and cash flow pattern is still the same. The long-term demand for educational content may be stable, but HMHC’s cash flow is not recurring and it has to compete for every new contract.

5

To find normalized earnings for HMHC in the long term, we need to adjust the reported numbers by taking out the amortization of publishing rights and adding back the deferred revenue into reported revenue. From normalized earnings, we can clearly see the short-term cycle in the business. From 2010 to 2013, the pressure from state budget kept the new adoption low. There was a pent-up demand release in 2014 mainly from the mass adoption in Texas and California but it cannot be sustained. However, management is implicitly calling a transition to a more stable business model and continued growth from 2014 level. Investors should definitely not value the company based on the cycle peak cash flow.

6

Maximizing short-term FCF while sacrificing long-term potential growth

While it is concerning that market is potentially valuing the company at cycle peak cash flow because of the accounting confusion, the solid business should provide long-term support. However, management’s recent strategies have raised the alarm for the long term investors.

  • Issue debt to support buyback

It is interesting that the management started to take debt to buy back stock only 2 years after IPO (5 years after chapter 11). Sometimes it is good for the company to add some leverage and enhance return. But excessive debt clearly does not work in HMHC’s industry. It was worse to buy back stock at cycle peak earnings and only enough to offset the options granted. But all this became reasonable when investors realize that previous debt holders granted management huge options during the bankruptcy period and the vesting period of those options was highly aligned with debt holders exiting time frame which is 2015/16.

7

  • Using third party technology platform

There is no doubt the educational content market is undergoing a fundamental change to digital platform and HMHC is still the market leader initially. But both HMHC and Pearson chose to license the technology platform from Knewton while McGraw-Hill purchased a proprietary technology to develop its own platform. In my opinion, HMHC’s management has underestimated the importance of investing in technology during this critical period. I think the recent change to digital content is just the first step in the transition. In the future, not only the content will be changed to digital, the whole business model will change dramatically as well. Although the third party provider can help HMHC save a lot of money and boost short-term FCF, it runs the risk of losing control in the interactive education and eventually become a mere content provider.

  • Squeezing the assumptions

On top of the buyback and technology platform choice, management’s assumption on pension also raised questions. Management increased discount rate from 3.8% to 4.3% in 2014 and expected return on assets from 6.7% to 7%. Adjusting the pension and new borrowings, the Liability to Asset ratio increased to 66%.

8

Conclusion

The biggest problem for investors to value HMHC is that there is no comparable company available in the market and the confusion in accounting clearly make the job harder. But after normalizing the earnings, we can see that the stock is currently trading at ~13x P/E on 2014 cycle peak earnings. The stock price has jumped from $12 at IPO to $27 last year but has since fall back to $19 level. I believe that the market will continue to realize the real earnings power as company fail to generate stable FCF. And in the long-term, management’s strategy to under invest will gradually erode company’s competitive advantage.

Iconix: The negative sentiment is FINALLY exaggerated

In 2015, the stock price of Iconix (ICON) declined from $34 to ~$6. The whole management team including long-time CEO Neil Cole has been replaced. The company had to restate its financial statements and it is still under SEC investigation for the accounting issue. The market painted a picture of a rogue CEO aggressively taking debts to buyback stocks and dump his shares before leaving the company. Investors began to question whether the whole brand management business is just part of the fraud. The biggest question I had after reading this story is why it took the rogue CEO 23 years to execute the fraud. He must be really patient. After digging deeper into the story, I found it is more complicated. The aggressive use of cheap convertible notes to finance the acquisitions during 2012-13 was the source of the problems. It forced management to buy back shares to counter potential dilution and eventually rig the accounting as things fall apart. There is no question that management did wrong things along the way, but the fear that the whole business is a fraud is also exaggerated at current valuation. With long-time turnaround expert Peter Cuneo in control as CEO, there is still value in this company.

Solid business model but poor capital allocation

Iconix is a brand management company with 35 brands categorized into Women, Men, Home and Entertainment. It licenses those brands to retailers and collects fees based on percentage of product sales. Here is a very brief idea about the business model:

Buying a brand -> Signing licensing contract -> Collecting cash and buy another brand

Almost half of company’s brands were licensed exclusively to one of the big retailers (Walmart, Target, Seas/Kmart, Macy’s or Kohl’s). The business model is actually very sticky. When a retailer has involved and co-invested in a brand for several years, it is unlikely to give the brand away. There are two important things to succeed in this business. First, management needs to find undervalued brands and build long-term relationship with the big retailers. Second, a good capital structure and efficient capital allocation can amplify the return. Neil Cole, as the founder of Iconix and one of the pioneers in the industry, is definitely good at the first. But he failed miserably in the second and almost brought down the company.

Acquisitions supported by $700m convertible note

1

From 2011, management team has frequently talked about cheap financing options like securitization, high yield bond and especially the convertible note in the conference call. The company took $700m note during 2012-13 at cash interest rate of 1.5%-2.5% with convertible options at the price of ~$30 per share. (ICON was trading at around $18 at that time). In my opinion, the pressure to get to $30 stock price was behind the buybacks and the eventual accounting issue. With the huge stock price decline in 2015, the once cheap convertible note becomes an unbearable liquidity problem in 2016. Neil Cole’s strategy to expand globally and enter entertainment segment was a correct move to diversify from the core licensing to US big retailers. He actually built the diversified global presence with the brands like ‘Peanuts’, ‘Strawberry Shortcake’ and ‘Umbro’ in addition to the core US brands. The company now generates ~$400m annual license fee with a ~50% EBITDA margin. But his choice to build it quickly with cheap convertible notes rather than slowly with internal resources has put the company in great danger.

What is left for the equity holder?

The Iconix stock is currently trading at $5.7 with a market cap of $280m. A valuation based on earnings and FCF does not make sense anymore because of the heavy debt burden. The company was historically traded at 13x EV/EBITDA and 8.5x EV/Licensing fee. Private acquisitions of brands were usually considered reasonable or relatively cheap at 5x licensing revenue. If the company’s brand is still of relatively good quality (which I think is the case), the current valuation can be very attractive considering the track record of the interim CEO Peter Cuneo, a turnaround expert who led Marvel from bankruptcy to $4bn sales to Disney. A sale of the whole company at 5x EV/Licensing fee will generate an 88% return for equity holder.

2

Moreover, several recent developments have showed that management still has the options to deal with the liquidity problem and the default is not likely. (1) The majority holder of 2016 Convertible Note proposed publicly to refinance the deal with senior secured status, but there has been no response yet from the management team; (2) Two convertible notes due Jun 2016 and Mar 2018 is trading at significant discount to face value which presented buyback opportunity to Iconix; (3) Sports Direct, the original owner of ‘Umbro’ from UK, has bought 14.4% stake in the company in recent months.

Conclusion

After the crash of Iconix’s stock price in 2015 and the ongoing SEC investigation, it is reasonable to be cautious about the business. However, a detailed look at company’s history showed that the crash is more likely to be a failure of financial engineering. With 35 brands generating $400m annual licensing fee and a turnaround expert in control, the Iconix stock is attractive. The eventual solution to the liquidity problem will serve as a catalyst to the stock price.

Apple: It’s Not 2013 Again

Summary: The future of Apple stock is once again becoming a hot topic in the market. The stock’s recent price decline has reminded investors of 2013 when the price tumbled from $700 to $400. Could this be a similar opportunity to buy? In my opinion, this time is different. Although Apple is currently trading at a multiple similar to the 2013 trough, the drivers behind the stock have completely changed. Since 2013, the deal with China Mobile, the introduction of a bigger screen, and the focus on the 64G version have pushed the iPhone to its market limit and helped the stock price to almost double. In 2013, the stock’s investment success mainly depended on Apple executing obvious strategies to capture a clear market and this gave the investors free options on new product categories. However, as Apple has pushed iPhone sales to the extreme for the past three years, the future stock price will be all about new product categories as the company’s risk-return profile has significantly changed.

Push iPhone to Its Limit

Impact from China Mobile deal in one-time: Market has still not fully understood the importance of the deal and why the success of the past two years cannot be repeated. China Mobile is the most important carrier in the country because it controls the market for a large group of people who work for state-owned companies or government entities. These people receive full reimbursement for their monthly mobile bills and so they pick the best phone in the network. This was Samsung prior to Apple’s deal. Then most of the people in this group chose to pick their iPhone freely in the past two years (well, some people may argue about their phone choice if both phones are free). The exciting growth from this source is more like a binary shift than an indicator of potential growth in China. To some extent, the Chinese government became one of the biggest paying customers for Apple and recently this customer has not been in a good financial condition.

1

Bigger is better but further upside is limited: Besides the China Mobile deal, the introduction of a bigger-screen iPhone and the elimination of the 32G version helped to maximize Apple’s market share and profitability. One big advantage Samsung had three years ago was the bigger screen. But there is nothing preventing Apple from making a bigger phone (except some words from Steve Jobs), so the short-term competitive advantage was completely unsustainable for Samsung in 2013. In the past three years, Apple has used very effective strategies to grab the pieces it left on the table, both dominating the high-end market and squeezing every possible dollar by pushing customers to the 64G version. It is very easy for analysts to project an ever-rising revenue, but it will be very hard for Apple to achieve significant growth from 231 million units of iPhone sales at $670 each in 2013.

2

Valuation and Buyback

Apple has been increasing cited as a value investment because of its low valuation. Current EV/FCF of ~6x is close to its trough level in 2013, but there was also a clear trend of a declining multiple as iPhone sales grew. With EV/FCF at 5x–6x, the market is again saying that the iPhone’s growth has peaked. While the multiple may not have been justified in 2013 with potential customers from China Mobile and Samsung Galaxy users, Apple completely dominates the high-end global market now.

3

For buyback, Apple started this program in 2013. The initial signs of a buyback can be traced to March 2013 when Luca Maestri joined Apple from Xerox. If you looked at his experience, you would know that he was famous for his dedication to stock buybacks. But good capital allocation requires more. The program has been successful in the past three years as Apple optimized its iPhone market. Whether it will be a good choice is still a question when the company’s growth depends on its success in the new product categories.

Recommendation

In 2013, seeing Apple’s low multiple, investors could argue that the market was wrong. There existed a clear group of customers that Apple could reach with relatively simple strategies like dealing with China Mobile and a bigger screen. But when the iPhone reached market domination in 2016, the prolonged upgrade cycle and pressure on ASP provided a headwind for the next several years. Although Apple has repeatedly reinvented itself with new product categories, people should keep in mind that Steve Jobs was there every time.

Investors should avoid the stock at the current level as its upside potential is not large enough to justify taking the downside risk. A much larger invention is needed to move the biggest company in the world forward now.

GNTX: Dominant player in a growing market at a reasonable price

Summary: Gentex is the inventor of auto-dimming rearview mirrors and is the dominant manufacturer with a 90% market share. The company maintains the highest margin in the auto-parts industry because of its technology, manufacturing process, and patents. Gentex generated stable free cash flow with limited maintenance capex requirements. Significant growth potential still exists as global penetration rate of auto-dimming mirror is increasing from the current 27% level. Gentex’s 14% revenue exposure to Volkswagen caused Gentex’s stock to decline recently, but fundamental earnings power is still intact. Current valuation of 2014 PE at 15x underestimates the company’s strong competitive advantage and growth potential.

Investment Thesis

  • Dominant player with the highest margin in the auto-parts industry

Gentex’s gross margin of ~38% in the past 25 years is among the highest in the auto-parts industry. Gentex won its battle with its only competitor, Donnelly, with its unique manufacturing process, which resulted in better quality and reliability and a patent lawsuit. Even after Donnelly was acquired in 2003 by Magna, which is much larger in size, Gentex continued to gain market share. Its strong competitive advantage is also supported by a completely non-unionized labor force, lack of pension liabilities, and a unique incentive plan that gives 90% of the stock options to non-executive employees and requires executives to hold the company’s stock in an amount that is 3x their annual salaries.

  • Growth potential still significant as technology penetration increase

Despite volatile vehicle sales in the past decade, Gentex’s revenue has continued to grow as the global penetration of auto-dimming rearview mirrors increased from 16% to 27%. The trend continued to accelerate from interior to exterior mirrors and from the United States to the global markets. In addition, Gentex was able to expand its auto-dimming technology into the aerospace sector with annual sales growth of +50% in the past three years due to putting its mirrors on the Boeing 787. The increase of penetration of auto-dimming technology in the automotive industry alone is likely to provide the company with +10% annual revenue growth in the next five years.

  • Strong FCF but investment in the electronics businesses is a concern

Almost all of Gentex’s growth in the past was funded internally, and the company has always maintained a net cash position since its IPO. It generated fast-growing FCF with limited maintenance capex needed. However, management’s mindset to invest in the vehicle-related electronics businesses to counter annual price declines is a concern as Gentex does not have long-term competitive advantages in those businesses. It will be better capital allocation for Gentex to focus on widening the application of its mirrors.

Company Overview

Gentex is an auto-parts manufacturer in Zeeland MI. Its core technology is the auto-dimming mirror that it invented in 1982. Since then, it has built several businesses around this technology. The company started with rearview mirrors for vehicles and dominated the market with a 90% share. In 2010, the company entered the aerospace business by putting the auto-dimming mirrors onto Boeing 787s. Gentex also built new features on the rearview mirrors like assisted driving, video display, and garage door control to better utilize the screen. Besides the main business, Gentex also manufactures fire alarm equipment. This is a high-margin business but only contributes 1% of Gentex’s revenue.

Chart 1: Summary of core businesses

2
Source: Company data

Gentex has built the company to achieve an owner mindset throughout the company. There is no multi-layered reporting structure and every employee is empowered by several unique settings.

  • Management team: CEO/Chairman Mr. Fred Bauer (72) is the founder of the company and hold 3% of its shares. He maintains a low profile and mainly focuses on running the business in the long term. Although the company gives guidance on its annual performance, the CEO rarely talks to analysts or grants interviews. The management team has a strong track record of growing organically and good capital allocation.  
  • Incentive plan: Gentex has a broad incentive plan to align the interest of employee with the shareholders. Compensation at the executive level is reasonable. Over 90% of the stock options are granted to non-executive-level employees with the grant-date market price as exercise price vesting over five to seven years. All executive-level officers are required to hold at least 3x their annual salaries in the company’s stock.
  • Labor force: Unlike its peers in the industry, the workforce in Gentex is not unionized and there is no pension liability. Combined with the incentive plan, this structure has created an ownership mentality across the whole company and aligned the interests of the employees with those of the shareholders.

Competitive advantage

For the past 25 years, Gentex’s gross margin level of around 38% has looked more like Apple than an auto-parts manufacturer. The consistently higher margin resulted from the long-term building of a competitive advantage around technology, process, and patents. The company invested heavily in R&D to maintain its leading position versus competitors, and it enjoys a much higher operating margin as well.

3

  • Advantage in quality and reliability

Since the invention of auto-dimming mirrors decades ago, Gentex has always had a strong hold on the automotive rearview mirror market. In the early 2000s, Donnelly, the only competitor, caused some troubles by imitating the product and gaining market share. In 2003, Donnelly was acquired by Magna, which has much larger resource than Gentex. However, it turns out that the product from Donnelly has serious reliability problems after several years of usage. Automakers gradually shifted back to using only Gentex’s products. Even Magna was not able to resolve its problem despite its vast resources after the damage was done to its reputation. Gentex also protects its technology with around 500 U.S. patents. Moreover, its unique manufacturing process has contributed significantly to its lead in quality and reliability.

4

  • Economies of scale

Because of its dominant market control in the fast-growing, auto-dimming rearview mirror market and high R&D rate, Gentex was able to maintain its technology and expend into other areas like aircraft mirrors. In the meantime, SG&A as a percentage of revenue constantly declined as volume grew, further expanding the operating margin.

5

Growth potential

Despite the fast growth in the past 20 years, the penetration rate of auto-dimming technology is still at a relative low level on a global basis. Gentex will continue to enjoy the increasing adoption of its technology on both vehicles and aircraft.

  • Automotive rearview mirror

The market penetration started with interior mirrors in the United States and spread to exterior mirrors and the global markets. The global adoption rate is likely to continue to increase, providing strong support for Gentex’s revenue growth regardless of the total vehicle sales, which can be volatile.

6

  • Other growth potential

A new potential area for auto-dimming technology is the application of mirrors on aircraft. Gentex has started to provide auto-dimming mirrors for Boeing 787s and some high-end business planes. Although the revenue contribution is still small (~2%), this segment has been growing +50% for the past three years and presents a potential growth engine in the long term. Besides the new application of its technology, Gentex has also been adding new features to the existing mirrors. The recent acquisition of HomeLink is expected to provide some meaningful growth potential to the company.

Concerns about the company

  • Return on R&D and acquisition

Most of Gentex’s growth was organic, enabling the company to maintain a fast-growing FCF and a net cash position since its IPO. The requirement for capex was limited to maintain the moat in the mirror business. But the efficiency of the R&D (6%–-8% revenue) and an acquisition were questionable. Gentex used those investments in add-on features to counter the annual price declines negotiated with automakers. However, this strategy resulted in reinvesting cash into electronics businesses in which Gentex does not have a long-term competitive advantage. In the past decade, Gentex had three major product offerings in this category and two have failed to meet expectations. The initial success and high margin quickly faded under the fierce competition. The third product, the $700 million acquisition of HomeLink, has a similar problem.

Although Gentex is known as an auto-parts manufacturer, its core competitive advantage is in technology and processes to make its mirrors. It is better for the company to reinvest the cash flow to find more applications for its mirrors. And lowering the R&D expenses may be a more efficient capital allocation decision to maintain the margin. Management’s mindset to focus the investment on the electronics businesses within the auto industry is a concern for the investors as those electronic products with high margins will eventually face more competition in the market.

1

  • Volatile auto market and impact from Volkswagen scandal

Contrary to the general perception that a healthy auto market drove up the penetration rate, it was actually during the downturn that automakers added new features because of the competition. For example, Volkswagen added an interior auto-dimming mirror to most of its models in 2002, 2005, and 2009 when its revenue declined. As a result, Gentex’s growth followed a pattern of penetrating into more models during the bad times and reaping the benefits during the recovery. The recent slowdown in the emerging market can be a potential hit to the short-term earnings but will also be a catalyst to increase the penetration on the global basis. Channel checks with purchasing managers from China automakers confirm the increasing competition and the need to add potential features.

2

In terms of Volkswagen scandal, because most of the models involved adopted auto-dimming technology around 2003 and all of its major competitors have installed the technology long ago, the decision to shift purchases from Volkswagen will not have a big long-term impact on Gentex.

Valuation

  • Assumptions and DCF

PT of $20 was based on a lower global production CAGR in the next five years while the penetration rate increases. The model is also based on the assumption that the gross margin will decline cyclically, but the SG&A and R&D as a percentage of revenue will improve. DCF was based on a WACC of 8% and a terminal growth rate of 2%. The Table 1 summarizes the major assumptions and the reasons behind them.

Table 1. Assumptions

3

Table 2. Market Implied Valuation from DCF

4

  • Sustainable Free Cash Flow and multiples

Because of heavy growth investment in R&D and the acquisition, a better measurement of the company’s sustainable free cash flow (FCF) is to exclude part of the R&D. The company’s sustainable FCF actually comes from two parts: 1) the mirror business is protected by strong moat (80%) and 2) the electronics businesses are highly competitive (20%). Adjusting for volatile items, P/Sustainable FCF is trading at 11.7x, which is close to the lower end of the historical level. Considering the extreme case of losing all the electronics business and reversing to industry-normal R&D level, Gentex would still maintain its moat because of the existing technology, processes, and economies of scale. Then, the company would be trading at 16x FCF. Despite the distraction from non-core businesses, Gentex has not weakened its competitive advantage during the reinvesting process. The company will still have the potential to benefit from increasing penetration of the auto-dimming technology in the auto market and other industries like aircraft.

 5